Category Archives: Coding

JaegerMonkey – Fast JavaScript, Always!

Mozilla’s JavaScript optimizer, TraceMonkey, is pretty powerful. It carefully observes loops and converts them to super-fast assembly. We call this “tracing”.

That’s great and all, but there’s a problem: sometimes tracing doesn’t work. Loops can throw curveballs that cause tracing to stop. Especially with recursion, or lots of nesting, it can be very difficult to build good traces on complex code.

Other JavaScript engines, such as Nitro (present in WebKit/Safari), take a simpler approach. Instead of compiling loops to assembly, they compile entire methods (functions) to assembly. The generated code is much more generic than tracing, so while it is not as fast, it can handle any curveball.

What we’ve found is that when tracing works, we’re faster than the generic approach. But when tracing fails, we have to fall back to our old-school interpreter. At that point your JavaScript runs about as fast as it would in 2007-2008 (i.e. before Firefox 3.5, Safari 4, Chrome, etc).

That’s not acceptable, and we need to fix that. Trace compilation is still an active area of research (one which we’ll continue to work on) – but in the interim, we need to make sure our “slow path” is at least as good as the competition.

The question we’ve been asked, and we’ve been asking of ourselves, is: Why couldn’t we trace and keep going SUPER AWESOME FAST, and when tracing fails, fall back to STILL REALLY FAST?

Enter JaegerMonkey.

Our new project, JaegerMonkey (or JägerMonkey), has exactly this in mind. We’re taking the tried-and-true approach of other vendors, and bolting trace compilation on top. Once the two are interacting seamlessly, you’ll have a much more consistent – and fast – JavaScript performance experience.

Dave Mandelin, Luke Wagner, Julian Seward and I have been sprinting the past few weeks to get something basic working. To emit actual machine code, we’re using some very pretty classes (“macro assembler”) from Nitro. That’s been a real treat; it’s well-abstracted and C++ish, and allowed us to get to work on the actual compiler very quickly.

Our compiler is simple so far. Before interpreting a method, we translate each bytecode into some pretty generic assembly. For example, an “ADD” opcode will emit assembly that can handle both fast cases (adding two numbers) and slow cases (adding, say, an object and a string).

Contrast this to tracing, where the types are known, and pinned, statically – it does not need to handle any extra cases that might come up. In the whole-method compiler, the generated code must handle all unexpected variations in control or type flow.

After the function is compiled we execute it right away – the interpreter is skipped entirely.

Early Progress.

We’ve barely started and the results are already really promising. Running SunSpider on my machine, the whole-method JIT is 30% faster than the interpreter on x86, and 45% faster on x64. This is with barely any optimization work! When we integrate tracing next week, we’ll already start to see the benefits of both working together.

For a more in-depth study, Dave Mandelin has blogged about our early performance gains, what’s done, up-and-coming, etc.

As we move forward, the two compilers will be tightly integrated. The method compiler will be able to identify loops and invoke the trace compiler. The trace compiler, if it decides a method is too complex to inline, may decide to invoke the method compiler.

The future of SpiderMonkey is bright and shiny, and we’ll be talking more about the project as it reaches major milestones.

In the meantime, if you are interested in learning more, I invite you to look at JaegerMonkey on the Mozilla wiki, and our makeshift source code repository. We also hang out in #jsapi on irc.mozilla.org.

64-bit TraceMonkey!

As of an hour ago, Mozilla’s JavaScript engine now has 64-bit JIT support turned on by default in the TraceMonkey tree only. We currently don’t ship a 64-bit browser, but we will eventually, and this is an important step in making sure we’re staying optimized on all major platforms.

If you are bleeding-edge and build your own 64-bit Firefox, you can now easily try out the JIT and report any problems.

A nice discovery was that the 64-bit engine as a whole outperforms 32-bit builds. SunSpider ran about 20% faster, comparing both 32-bit and 64-bit builds with and without the JIT.

For more information see this newsgroup post on
mozilla.dev.tech.js-engine

Quick String Interning Benchmark

While working on a project, I was wondering how to most efficiently implement string internalization. String “interning” is when two strings that compare true always have the same reference. This is quite nice as you can test if two strings are equal by just comparing their pointers.

It seems everyone uses hash tables for this, and indeed when I asked someone with more VM experience, he suggested using hash tables as well. I was still curious though, especially since SourceMod has a fancy-pants compressed “double-array” trie implementation. We knew that insertion time was poor, but I secretly hoped that this cost would be amortized over the much faster retrieval case.

I took a dump of ~5MB of plugin text from the forums and extracted all syntactically valid identifier tokens (including ones found in comments and strings). In total I had 553,640 strings, of which 19,852 were unique. This seems pretty reasonable as people tend to use similar names for identifiers. I set up four benchmarks:

  • std::map<std::string, int> — Typical STL container (red-black tree I think)
  • SourceMod::KTrie<int> — SourceMod’s Trie container
  • SourceHook::THash<const char*, int> – SourceHook’s “TinyHash,” chained hash table
  • SourceHook::THash<std::string, int> – Same, with more allocation involved

As a note, “TinyHash” is one of the first ADTs I tried to write, and it shows. Its stock find() function iterates over the whole table, instead of computing a hash, which is really slow. I filed a bug on this and hacked up my local copy to benchmark.

Each test gets run twice. The first “batch” run goes over all identifiers and inserts them if they are not already in the container. The second “retrieval” run does the same thing, except now there will be no string insertions since the table is populated.

Here’s the results, in milliseconds. I used the Intel C++ Compiler, version 10, on my Macbook Pro (2.4GHz Core 2 Duo, 4GB RAM).

Whoa! Everyone was right. Well, I knew that insertion on our Trie was pants, but I was surprised to see that the cost was in no way amortized. In fact, it wasn’t even faster on retrieval! Why? I don’t know (yet), but if I had a guess, it’s because our Trie has to peek at memory a lot. David Gregg explained to me that the advantage of tries is sorting. He also theorized it might be faster on long strings, which is in line with my original benchmarks ages ago, where I used very long randomized strings. (Tries are also good for compression.)

Well, I has sad. Looks like we’ll be ditching KTrie for a chained hash table. At least for string interning. Someone is welcome to request a hash table ADT for SourceMod scripting as well.

I also benchmarked non-PGO ICC and non-PGO g++-4.2 if you would like to see other compilers.

Note 1: Go article returns next week.
Note 2: Firefox 3.5 comes out tomorrow (June 30th!)

More Type Instability and Specialization in JavaScript

A while back I talked about type instability in JavaScript, and how TraceMonkey optimizes it by connecting type-specialized traces together. This stitching mechanism was only half complete.

TraceMonkey has a global cache called the “trace monitor.” As the original version did not type-specialize any loop (tree) more than once, there was a design decision to only monitor one global object at a time. This is significant because there can be many global objects in JavaScript. Each window in the browser has its own global object as a security measure (windows can’t poison other windows).

Let’s say there’s a window A with global object of shape X. The monitor notices this and compiles a bunch of traces specialized to that global object. Then window B with global object of shape Y starts running an intensive loop. The trace monitor kicks in, notices that the global object is different, and flushes its entire cache. A cache flush invalidates every trace, meaning the JIT’d code is deleted.

The trace monitor also locked itself to the types of every property in the global object it was tracking. If any variable in the global object changed, the cache would flush, even if most of the traces never used this variable. Any type of global instability, either from changed global variables or different global objects, would throw out all JIT’d code.

This would be fine:

Select All Code:
function f() { 
   for (var i in ["1", "1", "1", 1, 1, 1.5])
      ;
}

This would continually flush the cache, as i is global and type unstable:

Select All Code:
for (var i in ["1", "1", "1", 1, 1, 1.5])
 ;

Luckily we’re now working on fixing this, and the first major step landed last week. The trace monitor no longer keeps track of global types. This information is tracked in each tree and each guard, and the old principles of “multitrees” apply. If a global variable is not type-stable across a loop, the loop is left unclosed and the dangling edge becomes an “unstable exit.” If there ever exists a tree whose entry types match an unstable exit, the edges are joined together.

See the original post for diagrams.

The only additional complication with global variables is that they are lazily tracked by the trace monitor. This is an optimization. If there are 50,000 globals in play and only 5 ever get used, there’s no need to iterate through every single one. As traces get recorded, every tracked global variable is included in a tree’s specialization. Old trees that don’t include newly tracked globals will be updated automatically. This removes the need for complex dependency tracking for branches and nested trees.

So now that global types are specialized pre-tree, what’s the next step? The plan is to include the actual identity of the global object in per-tree specializations. The easiest way to do this is probably to probably divide up the trace monitor, so that it can maintain separate caches for each global object. This way if a global object’s shape changes, only its cache will be flushed.

Fine-grained specialization continues to be the most interesting and promising aspect of trace compilation for dynamic languages.

TraceMonkey and Type Instability in JavaScript

Work on TraceMonkey continues! TraceMonkey is Mozilla’s JavaScript JIT based on Franz-Gal trace compilation. The JIT ships with Firefox 3.1 and can be enabled in the beta via about:config. This article is about how TraceMonkey was recently changed to handle type changes in JavaScript data flow.

Introduction

The greatest advantage to a trace compiling JIT rather than a method compiling JIT, for dynamic languages, is type specialization. Observe the following loop:

Select All Code:
function f(c) {
  for (var i = 0; i < 500; i++)
    c += 2;
  return c;
}

In a traditional JIT this method would need to be compiled generically enough to use all possible incoming types. The function could be invoked using either a string, object, number, or anything — and the compiled code must account for that. Optimizing further requires static analysis.

Type Specialization

TraceMonkey’s approach is remarkably different. If a hot path (loop) is encountered, the runtime behavior is observed, recorded, and compiled as a “trace tree.” If that loop is run using integers, the trace tree becomes a specialized chunk of assembly using straight integer math. Because trace compilation only compiles instructions that have been hit (for example, it may only compile one side to an if path), it’s much easier and faster to type specialize than doing aggressive static analysis.

This approach has worked very well so far. Except for type instability.

If that loop above were run a second time with c being a string instead, the original tree could not be used as the types are not compatible. This resulted in a “tree mismatch,” and excessive tree mismatches meant destroying the tree to make way for another. What if you could have multiple type-specialized trees for a given loop? Enter multi-trees.

Over the past week or so I have been working on (and now landed) my second major TraceMonkey patch — multi-trees.

Multiple Type Specializations per Path

TraceMonkey stores a cache of all trees. The bytecode location of each hot loop is mapped to a linked list of trees; the first in each list is called the “root peer.” Each tree records typemaps, which are a simple arrays describing the data type of each slot in the stack. A tree contains one entry typemap, which is the set of types the stack must have in order to execute the compiled tree.

The simplest case of multiple type specializations is the example above, where a simple loop’s typemap can alternate on entry. This is the easiest case to handle. The linked list is grown for each new combination of types. f(3) will create the root peer with an integer specialization. f('a') will link in a new tree with a string specialization.

To invoke a tree, the root tree is fetched and the list is traversed until a matching entry typemap is found. The tree is then executed. If no matching typemap exists, the list is appended and a new tree using the new typemap is recorded. This means there are multiple trees recorded for the same loop, and we pick one matching the types on the stack.

Type Instability Inside Loops

The hard cases involve type instability within the same loop. TraceMonkey relies on being able to close loops, meaning that the loop edge (tail of the loop) can jump directly back to the top. This can only happen if the entry type map is equivalent to the type map at the loop edge. For example, a number turning into a string can’t be closed because the compiled code at the top of the loop expects a double, and we never recorded a path to bridge the conversion back.

There are many reasons this can happen. Take the following dumb example:

Select All Code:
function g() {
  var q;
  for (var i = 0; i < 100; i++)
    q = 2.0;
  return q;
}

The first time we enter this loop, the entry typemap contains Boolean for q since it is undefined. When the loop reaches its first edge, q has changed to a Number. Recording starts on the second iteration, so now both the entry and exit typemaps will contain Number.

Now if g() is run again we can’t run the tree we just recorded, because it expects q to be a Number when it really starts out as Boolean. To solve this we immediately start recording a new tree. At the end we encounter a problem: in our tree, q started out as Boolean and now it’s a Number. This means the loop cannot be closed because the exit and entry points are not type compatible. Joining the ends would be incorrect.

To solve this we search for a tree X (on the same loop) whose entry types are identical to our ending types. If X exists we compile a “loop” that runs once, then immediately jumps into tree X. This resolves the type conflict by bridging the type flow to another loop. Visualization:

Figure 1

Delayed Bridging

What happens if no matching tree exists? Take this example:

Select All Code:
function f(var c) {
   var q;
   for (var i = 0; i < c; i++)
     q = 2.0;
   return q;
}
f(1);
f(1);
f(20);

The first call to f puts a counter that says “record a trace for me next time I’m reached.” The second call to f records a trace with a type instability: q flows from undefined to Number. Unlike the previous example though, there is no stable tree to complete the bridge.

To solve this, we have the top of each tree (where the entry typemap is stored) contain a list of unstable loop edge exit points for that specific tree. During the third call to f a stable loop will be compiled. We then use the following algorithm:

1. For all other peers that have compiled code,
2. For all unstable exit points in that peer,
3. If any unstable exit point has a typemap matching our entry typemap, bridge the points together and remove the unstable exit from its peer’s list.

This algorithm is invoked every time a main trace is compiled (that is, a trace that’s not tying to extend a branch off a tree). Once it runs in the above example we a diagram very similar to Figure 1.

The important result of this is that we can bridge many types of instability together. For example, imagine a scenario where two traces are mutually unstable. This is easily bridged:

Figure 2

Other crazy situations are handled as well. For example, stable loops with unstable branch exits, or chaining multiple unstable traces together (multiple levels of mutual instability). One case I ran into was something like this:

Figure 3

Nested Type Instability

The situation gets hairy with nested trees. Consider a loop like:

Select All Code:
for (var i = 0; i < 100; i++) {
  var q;
  for (var j = 0; j < 100; j++) {
    q = 2.0;
  }
}

In this example there’s an inner tree that will quickly type stabilize. When the outer loop starts recording, the inner loop’s incoming types will not match the existing root tree. In this case the outer loop’s recording is temporarily aborted and the inner loop immediately starts recording again under the assumption that it will record a type stabilizing trace. In this loop it does, and the two trees are connected together. The outer loop can then record and directly call into the tree that starts out with unstable types.

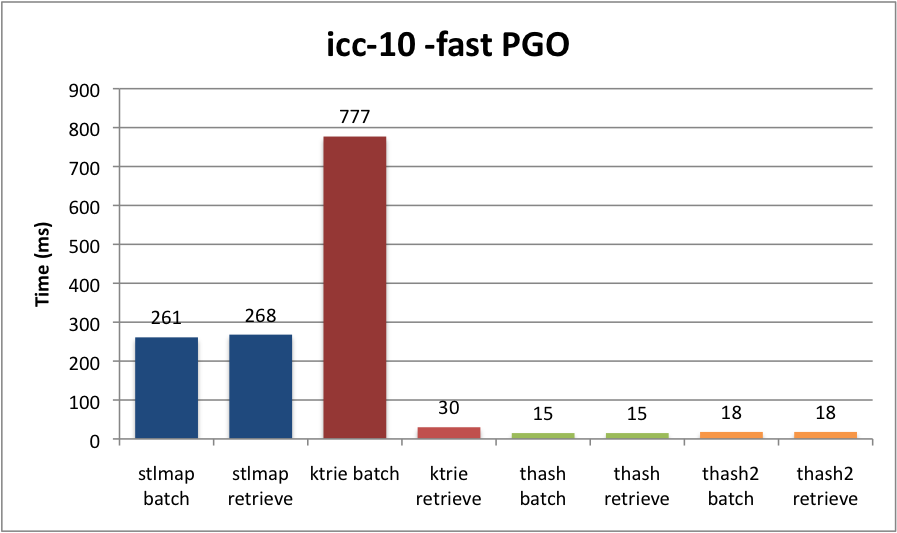
This solves all sorts of crazy data flow stability problems. Previously SunSpider was traced as very type unstable, and loop hoisted variables (such as the q in that example) served as tracing poison. They’re now handled fine. Our least favorite test, access-fannkuch, used to have 100,000 and even 200,000 side exits (exits from the JIT to the interpreter). It now only has 200 and it runs 2.3X faster than the interpreter (over an old 1.3X). Other cases like crypto-md5 are almost completely covered by tracing.

Thin Loops

Multi-trees go hand in hand with “thin loops,” a concept Andreas landed recently. The idea is that if a loop doesn’t close because it’s too short, we close it anyway and assume the best. That works really nicely for very thin loops, especially thin nested loops which would prevent the outer from recording. Unfortunately it doesn’t give thin loops time to type stabilize, so many thin loops are thrown out. For example:

Select All Code:
function h(c, k) {
  var q = new String('');
  for (var i = 0; i < c; i++)
    q = k + q;
  return q;
}
h(1, 'a');
h(1, 'a');
h(5, 'a');

Multi-trees solves this. The first call to h tells the JIT to start recording the next time h is called. When h gets called the second time a thin loop is recorded. But the types are not stable, and the loop cannot be closed – we get another dangling trace that runs once and exits. When h gets called a third time it type stabilizes. A new loop is compiled and the two traces are bridged together.

Note: h is not immediately stable because new String returns a JSVAL_OBJECT in SpiderMonkey, whereas the addition returns a JSVAL_STRING.

Type Speculation

TraceMonkey has a very cool optimization called type speculation. Floating point values like 30.0 or -12.0 fit into an integer. When TraceMonkey starts recording a loop it speculates that such “promotable” numbers are integers for the entire loop. When the loop closes, if the number in that slot changed to a double, the loop can’t be closed and the recording is thrown out. How do you tell it to not perform integer promotion next time that loop is recorded?

The original solution was an oracle, a simple lossy hash table. If an integer->double conflict arose the oracle would be told “please blacklist stack slot N for bytecode location X, so we don’t try to promote it to an integer.” Since the hash table is lossy this led to false positives as traces filled the JIT cache.

Multitrees rids most uses of the oracle. If a loop can’t be closed because of integer->double conflicts, a new trace is immediately recorded with the same conflicts demoted to doubles on entry. This is better than compiling bridged traces (int->double and double->double), because the extra time spent compiling has very little gain.

There is one case where the oracle is still important (global variables aside), in that the oracle can help memoize type instability for nested loops. If the JIT cache is flushed the oracle will still remember which stack slots can’t be promoted, and outer loops can be compiled faster. Thus the oracle only memoizes stack slots when recording inner tree calls.

There is also a case where we build similar traces that are impossible to connect. For example, two variables going from int->int in one tree, and double->double in a peer tree. If a branch from the first goes from int->double for one the variables but not the other, the traces cannot be connected without some sort of intermediate conversion logic. Perhaps with very bushy trees it would make more sense to build such intermediate bridges. For now we simply throw out the tree that is causing the problems (the original integer tree). This is safe because integers can always be boxed into doubles, so the second trace is all we need.

Problems

It’s not perfect. There’s potential for code/trace explosion if types are too unstable. The heuristics for deeply nested trees can get messy too. If there are many inner trees that are type unstable it can take a long time to build a stable outer tree.

Compared to the original “single-tree specialization” TraceMonkey, there are cases that get a little slower (although still faster than with no JIT). This is because the original algorithm aggressively pegged incompatible values into mismatching trees. For example, undefined (Boolean) was passed as a 0 for integer slots and NaN for double slots. This was wrong. For example, ((undefined == undefined) == true) but ((NaN == NaN) == false). And ((undefined == undefined) == true) but ((undefined == 0) == false). Other operators are hurt too. NaN is a poison value and causes any expression to return false.

So there were cases where the compiled code was simply wrong and produced incorrect results (but boy was it fast!). By the time this fault was discovered it was too late. Removing this aggressive coercion corrected a small percentage of code at the price of greatly reducing performance. Trees would continually get trashed because they mismatched. Multitrees solved this, but in some cases it uncovers new paths that don’t yet trace well.

Conclusion

As TraceMonkey improves, type specialization will bring JIT’d code closer and closer to C equivalents. Multiple type specialized trees furthers us toward this goal. It solves a huge class of correctness bugs and improves performance in many scenarios where nested trees could not be compiled.

SourceMod JIT Changes

A few months ago I made some major changes to the SourceMod JIT, the first major changes since the thing was originally written two years ago.

Pawn suffers from many problems. One of my (least) favorites is the lack of separation between a runtime and a context. Some language implementations don’t seem to have this either. Python, notably has a global runtime and no notion of a context as far as I can tell. SpiderMonkey abstracts both. Lua seems to have both and combines them into one structure.

Pawn historically shoved both a runtime (VM code+heap) and a context (thread stack+locals) into the same structure, and SourcePawn originally did the same. The problem was that once you created this structure, it was immutable. You couldn’t add code or data. Sharing between scripts meant jumping runtimes which is very expensive to marshal. Each plugin having its own runtime and context is a waste in every sense of the word.

Unfortunately the design of the VM doesn’t really let us fix that. References to memory are not typed, and references to global memory can’t be easily deduced at verification time. This makes it impossible to put multiple scripts into one structure with a common heap. For example:

const.pri 50
load.pri

This is a load from global data at address BASE+50. SourcePawn is a straight-line JIT, and some form of data flow analysis would be needed to catch and relocate these references. Although we could change the compiler, we have to be backwards compatible with old bytecode.

So stuck with this crummy design I went on a spree of changes to try and clean things up. The first was separating the ideas of a context and a runtime – although runtimes are still per-plugin, the invocation model is now centered around Functions and Contexts. That is, the API for calling a function used to require a runtime and a code addres. It now requires a function object and a thread context. The API looks a whole lot cleaner, but it’s just lipstick on a pig – internally, contexts and runtimes are still tied together because of Pawn’s limitations.

Though as part of those changes the implementations for contexts and runtimes got moved into the JIT library. Previously they were separated, the JIT lived half its own library and half in SourceMod. SourcePawn is officially standalone now. For testing I was even able to hack up a shell app to load plugins using the DLL and headers from SourceMod snapshots.

The third big change was to move to whole-method incremental compilation. Previously the entire code blob of a plugin would get JIT’d on load. Now we only JIT functions once they’ve been run for the first time. This speeds up load time noticeably; compilation time becomes spread out, and the hot paths (such as OnGameFrame) are hit quickly, so gameplay is unlikely to be interrupted. It’s faster to compile a smaller chunk of code anyway, especially since SourcePawn does little to no JIT-time analysis.

Functions that call other functions (via the CALL opcode) are special. If the target function is already compiled, a direct call is generated. If the function is not already compiled then a special thunk is generated instead. If the thunk is ever executed it checks to see if the function has been compiled yet. If it hasn’t, it compiles it. The thunk completes by replacing itself with a direct call to the target function.

The last big change was a rewrite of our debugging implementation. The previous concept (lifted from AMX Mod X) was pretty bad. Pawn emits BREAK opcodes throughout methods to indicate line changes. The JIT would change these BREAK opcodes into a function call called the “debug hook.” The debug hook would look for changes to the frame pointer to deduce whether the call stack was entering or leaving a function. This was really expensive so you had to explicitly enable debug mode to get error diagnostics.

The new implementation emits a single instruction for each BREAK opcode:

mov [save_pc], pc

For the CALL opcode, the pc (program counter) is pushed onto a separate stack (the call stack). When a CALL finishes, the top value is popped. If a function throws an error, the complete stack trace can be recovered from a combination of save_pc and the call stack. The pc can be used to find the line, file, and function in the debug info. This is fast enough to remove re-JITing to debug a plugin.

So SourcePawn is a little more mature now. It’s got an isolated runtime, it incrementally JITs, and the design (on the outside) is a lot cleaner. I wouldn’t recommend using it in other projects yet, but it’s at a point where if we wanted to take it further we could do so without more massive rewrites.

Tamarin Tracing, Intro to Tracing JITs

I’ve been porting Tamarin-Tracing‘s code generator to AMD64. The idea behind Tamarin-Tracing is that you have an interpreter for some dynamically typed language, or an environment where a fully optimizing JIT would be too expensive.

As the interpreter runs, it will decide to start tracing sequences of code that could be “hot paths” for performance. For example, loops are good candidates. Once tracing begins, the interpreter captures the state of every instruction and emits it as a “trace.” A trace represents the exact sequence that was taken through a particular control path.

A good example could be a method call. For example, “obj.crab()” in languages such as JavaScript or Python requires a dynamic lookup, since the type of “obj” is only known at run-time. You can emit a trace like this:

LET x = TYPEOF(obj)
TRACE:
   IF TYPEOF(obj) != x
      EXIT
   ELSE
      CALL x::crab ON obj

This trace says, “Assume object is type X. If it’s not, we’ll have to recompute it, but if it is, we can optimize this to a direct method call.” Later, the trace will be analyzed, optimized, and then compiled to assembly. Next time the interpreter needs to call the method, it will see that a compiled trace exists. The compiled trace will first check that the type of “obj” matches the path it originally took. If not, it will exit back to the interpreter. This check is called a “guard” and the exit is called a “side exit.” Otherwise, the optimized method call is invoked. A side exit can later turn into another trace; these branches form a “trace tree.”

Anything can be traced. For example, one side of an “if” branch can be traced. The resulting compiled code would be for the “hot” side of the branch. If the “cold” side is detected, it would jump back to the interpreter and a new trace might branch off. Another case is addition for weakly typed languages. For example, “5 + '3'” is valid in JavaScript, and a trace might optimize numeric conversion paths.

One of the most surprising features is that the compilation granularity is much finer. SourceMod compiles entire scripts to native code (known as “ahead of time” compilation). Sun and Microsoft’s JITs compile methods at a time, and thus compilation is deferred until a method is needed. A tracing JIT, however, is capable of compiling only pieces of code that are deemed as important. It can trace through anything it wants, including method calls, and return control back to the interpreter when the hard work is done.

This is a pretty new concept that seems to be the future of optimizing dynamic languages. JITs for these languages typically hit performance boundaries because the native code must either perform run-time conversion itself or exit back to interpreter functions for resolving types. There is supposedly a LuaJIT in the works for possibly my least favorite language (LUA), and someone on IRC mentioned a tracing JIT in the PyPy project (though I have not looked into it).

Unfortunately, benchmarks have continually shown that Tamarin Tracing is just plain slow. Some people are wondering why we’re even bothering with it. What’s important to recognize is that the speed of the tracer is bound to the speed of the interpreter. Tamarin Tracing is highly experimental, and the interpreter Adobe packaged with it is not optimized. The tracing engine, however, can be easily detached from the interpreter. Since Mozilla already has a reasonably fast interpreter (SpiderMonkey), our new project is to couple the two together, as “TraceMonkey,” so the interpreter can emit traces.

A trace is a set of low-level, abstracted instructions, internally called “LIR.” Each “word” of LIR is 32-bits — an 8-bit opcode and three optional 8-bit operands. For example, encoding a 32-bit immediate value requires an empty LIR_imm32 word and another word for the value. These LIR opcodes are designed to be fairly platform agnostic, but more importantly, they are intrinsically in SSA form. This makes liveness analysis, common sub-expression elimination, and other optimizations much easier.

Since TT’s interpreter is not 64-bit safe, I’ve been testing my port by writing programs directly in trace LIR. For my first function I implemented XKCD’s getRandomInt() { return 4; } function. Each label is the word/instruction number.

1: imm64 4      ; immediate value of 4
4: imm64, &addr ; immediate value, address from C code
7: sti 1, #0(4) ; take the pointer value of instruction 4, store value in instruction 1 at offset 0.
8: x            ; exit the trace

These traces are compiled backwards. In this example, the epilogue is generated first, and the last instruction to be generated is the first instruction of the prologue. Generation is a single pass and thus code size is not computed beforehand. Executable pages are allocated one at a time. If there is not enough space to encode a full instruction in the current page, a new one is allocated and a JMP is generated to bridge the code.

That’s it for my rough overview. If you’re interested in details of the tracer, including LIR and everything after, I highly recommend Dave Mandelin’s Tamarin Tracing Internals articles (parts 3, 4, and 5). He provides some excellent insight into the optimizations it makes, and I’ve been using the articles as a guide while reading the code.

SourceMod’s JIT Opened, Performance Ideas

Originally, we had a few motivations for keeping SourceMod’s JIT closed source. They are neither here nor there, but we’ve decided to open it. I’d like to talk a bit about what it is and what it isn’t. If you’d like to see the source, it’s in sourcepawn/jit/x86.

A JIT is a technology that, “when it’s needed,” compiles code from one form to another for optimization. For example, the Java JIT compiles Java bytecode to native assembly. There are three levels of granularity in a JIT:

  • Whole Program. The JIT compiles the entire program in one go (actually an “ahead of time” compiler). No granularity.
  • Methods. The JIT compiles functions one at a time as they are needed. Coarse granularity.
  • Tracing. Can compile any path of code anywhere in the program. Fine granularity.

Tracing JITs are new and still seem to be experimental. Traditional JITs, like Microsoft’s and Sun’s, compile functions one at a time. SourceMod’s JIT is a whole program compiler. We chose this route for a few reasons:

  • It’s easy.
  • We’re not concerned about loading/compilation time since Half-Life servers take forever to start anyway.
  • Even so, the cost of computing optimizations on a SourceMod plugin is extremely cheap.
  • There is no performance gain from tracing because Half-Life runs on good processors and all types are statically known.

Why is optimizing Pawn code so easy? It has a simple, two-register design internally. This has a number of really nice implications:

  • The generated patterns are simple. Peephole optimization in the source compiler does a good job at reducing expressions.
  • The two registers that represent machine state can be easily mapped to processor registers, since nearly every processor has two scratch registers.
  • Types are static and optimal code can be emitted.

Therefore SourceMod’s JIT is “dumb” for the most part. It performs a massive peephole “search and replace” of every Pawn bytecode to native machine code. Where it wins is that the assembly is highly handcrafted to the x86 ISA, rather than piped through a processor abstraction layer. faluco spent a lot of work optimizing moves and stores to reduce things like pipeline stalls. A pipeline stall is when one instruction depends on the result before it. For example, if x86 sees an address coming up, it tries to pre-fetch the final computed address onto the address pipeline. This is why LEA is called a “free” instruction on x86 (because the computed result is “already there”). If the address computation requires a prior instruction, the pipeline will be stalled.

SourceMod performs some other more general optimizations. It optimizes for space by emitting short instructions when possible. Certain function intrinsics are implemented in inlined hand-crafted assembly (like the GENARRAY and FILL opcodes). Native dispatch is entirely inlined down to assembly.

A special amount of attention is given to switch cases. If all case values are consecutive they are optimized down to a jump table rather than a series of if statements. The sequence can start at any number and end at any number, as long as no number is skipped.

Since Pawn doesn’t have types, the JIT performs some peephole optimizations on certain natives. For example, if it sees the ‘FloatAdd’ native, it will optimize the code down to FPU instructions. This is a huge bonus because native dispatch is expensive (the VM’s internal state must be cached and then restored). This specialized peephole optimization occurs mainly on float natives.

The JIT maps Pawn’s two registers to EAX and EDX. This ends up being really nice, as they’re the two scratch registers used for lots of important things on x86. For example, a MUL instruction uses both, and many of the ALU instructions have shortened forms for EAX. The unfortunate side effect is that stack spilling can be common, but the Sethi-Ullman Algorithm shows that two registers will suffice for binary expressions.

The SourceMod JIT gets the job done. In terms of design considerations, it’s not perfect. Its optimizations are primitive, and it assumes the source compiler will do most of the hard work. But in the end, if fits the bill well. Pawn doesn’t have much complexity, and the scripts are fairly small.

I do have some future plans for the JIT. Some easy optimizations are that more float natives can be optimized away in the peephole pipeline. Similarly, if SSE/SSE2 is detected, faster instructions could be emitted instead.

With a little help from the compiler, we could completely eliminate a large class of useless performance losses in SourceMod. Pawn scripts use “local addresses” that are relative to a base pointer. With a little help from the compiler, the JIT could eliminate local addresses completely. This would greatly improve generated code performance and turn LocalTo* calls (which extension writers should hate by now) into nops. There are other implications too – calls from plugin to plugin would become direct calls instead of slowly marshaled through PushCell() and GetNativeCell() and whatnot.

Lastly, natives are expensive. It takes 28 instructions to jump into native mode. Unfortunately, calls like IsClientConnected() and IsValidEntity() can’t be implemented without native code. A possible solution to this is to introduce a few very specialized “native” opcodes into the JIT. For example, a check for IsClientConnected might look like this in an extended Pawn bytecode:

  proc
  push.s  0xC     ;push the first parameter (the entity index)
  getuseraddr 1   ;offset of &g_Players address in context::user[] array
  vcall 5         ;call function at virtual index N, GetGamePlayer()
  vcall 2         ;call function at virtual index N, IsConnected()
  ret               

The JIT would then compile this directly into the plugin, as if it were a stock. This would effectively let anyone write very fast natives in an abstracted assembly language, without incurring any native overhead. It is of course a lazy solution based on Pawn’s limitations, but definitely a decent attempt at gaining performance for very little work.

For now, I will likely back away from other lacking things in Pawn (like CSE, liveness analysis, optimizing register usage, etc). The principle reason being that the other proposed optimizations are likely to get more bang for the buck at this point. The fact that the JIT is hardcoded to assume EAX/EDX as the two storage registers means such extensive optimization would warrant a complete redesign for a dynamic register allocator. We wouldn’t be able to justify that until we freed up some of the registers required by Pawn (like the DAT and FRM registers for the local addressing mode, see earlier idea).

Programmatic Radio Control for Smartphones and Pocket PCs

Lengthy title, yes. I’m working on an application for my Windows Mobile 6.0 Phone, and I needed to toggle the radio (phone receiver) on and off. It’s not very difficult to disable and enable the radio programmatically, but it did take quite a bit of research since I’m new to this platform. I couldn’t find any good, well-written examples on this using Google, so I decided to discuss my solution.

I used Visual Studio’s “Windows Mobile 5.0 Smartphone SDK (ARMV4I)” emulator and architecture for testing. The code is written in straight C. The process is pretty simple:

  1. Initialize with the TAPI DLL.
  2. Enumerate all the line devices. Find the one called “Cellular Line”.
  3. Open the line, change its equipment state, close the line.
  4. Shutdown from the TAPI DLL.

For initializing and shutting down access to TAPI, I made a few helper functions.

Select All Code:
#include <tapi.h>
#include <extapi.h>
#include <string.h>
 
HLINEAPP hLineApp = NULL;
DWORD g_NumDevices = 0;
 
int InitializeLineUtils(LINECALLBACK callback)
{
	int ret;
 
	/* Init TAPI, get device count */
	if ((ret = lineInitialize(&hLineApp,
			g_hInstance,  /* From WinMain */
			callback,
			NULL,
			&g_NumDevices))
		!= 0)
	{
		return ret;
	}
 
	return 0;
}
 
void ShutdownLineUtils()
{
	if (hLineApp != NULL)
	{
		lineShutdown(hLineApp);
		hLineApp = NULL;
	}
}

The next step is to find a device matching a specific name. Device names can be either in Unicode or ASCII, so my helper function takes both to eliminate any conversion. First the device API version is negotiated, then the device capabilities are queried. Note that the structure to do this is pretty low-level — you have to reallocate memory until the device decides it’s big enough to squirrel all its data past the end of the struct definition.

This function finds a matching device and returns its negotiated API version:

Select All Code:
DWORD FindLineDeviceByName(LPCWSTR wstr, LPCSTR cstr, DWORD *pAPIVersion)
{
	LONG ret;
	DWORD api_version;
	LINEDEVCAPS *dev_caps;
	LINEEXTENSIONID ext_id;
	DWORD device_id, dev_cap_size;
 
	dev_cap_size = sizeof(LINEDEVCAPS);
	dev_caps = (LINEDEVCAPS *)malloc(dev_cap_size);
	dev_caps->dwTotalSize = dev_cap_size;
 
	/* For each device... */
	for (device_id = 0; device_id < g_NumDevices; device_id++)
	{
		/* Negotiate an API version (0x00020000 is my CURRENT) */
		if ((ret = lineNegotiateAPIVersion(hLineApp,
				device_id,
				0x00020000,
				TAPI_CURRENT_VERSION,
				&api_version,
				&ext_id))
			!= 0)
		{
			continue;
		}
 
		while (TRUE)
		{
			if ((ret = lineGetDevCaps(hLineApp, 
					device_id,
					api_version,
					0,
					dev_caps)) == 0
				&& dev_caps->dwNeededSize <= dev_caps->dwTotalSize)
			{
				break;
			}
 
			if (ret == 0 || ret == LINEERR_STRUCTURETOOSMALL)
			{
				dev_cap_size = dev_caps->dwNeededSize;
				dev_caps = (LINEDEVCAPS *)realloc(dev_caps, dev_cap_size);
				dev_caps->dwTotalSize = dev_cap_size;
			}
			else
			{
				break;
			}
		}
 
		if (ret != 0)
		{
			continue;
		}
 
		if (dev_caps->dwStringFormat == STRINGFORMAT_UNICODE)
		{
			const wchar_t *ptr = (wchar_t *)((BYTE *)dev_caps 
				+ dev_caps->dwLineNameOffset);
			if (wcscmp(ptr, wstr) == 0)
			{
				*pAPIVersion = api_version;
				return device_id;
			}
		}
		else if (dev_caps->dwStringFormat == STRINGFORMAT_ASCII)
		{
			const char *ptr = (char *)dev_caps + dev_caps->dwLineNameOffset;
			if (strcmp(ptr, cstr) == 0)
			{
				*pAPIVersion = api_version;
				return device_id;
			}
		}
	}
 
	return -1;
}

Lastly, helper functions for opening and closing lines:

Select All Code:
LONG OpenLine(DWORD device_id, 
	      DWORD api_version, 
	      HLINE *pLine, 
	      DWORD inst,
	      DWORD privs,
	      DWORD media)
{
	return lineOpen(hLineApp,
		device_id,
		pLine,
		api_version,
		0,
		inst,
		privs,
		media,
		NULL);
}
 
void CloseLine(HLINE line)
{
	lineClose(line);
}

Now we can write a simple program to toggle the radio:

Select All Code:
VOID FAR PASCAL lineCallbackFunc(DWORD hDevice, 
				 DWORD dwMsg, 
				 DWORD dwCallbackInstance, 
				 DWORD dwParam1, 
				 DWORD dwParam2, 
				 DWORD dwParam3)
{
}
 
int WINAPI WinMain(HINSTANCE hInstance,
		   HINSTANCE hPrevInstance,
		   LPTSTR lpCmdLine,
		   int nCmdShow)
{
	HLINE hLine;
	DWORD state, radio_support;
	DWORD cell_api, cell_device;
 
	if (InitializeLineUtils(lineCallbackFunc) != 0)
	{
		return 1;
	}
 
	if ((cell_device = FindLineDeviceByName(
			L"Cellular Line",
			"Cellular Line",
			&cell_api))
		== -1)
	{
		ShutdownLineUtils();
		return 1;
	}
 
	if (OpenLine(cell_device, cell_api, &hLine, 0, LINECALLPRIVILEGE_NONE, 0) != 0)
	{
		ShutdownLineUtils();
		return 1;
	}
 
	if (lineGetEquipmentState(hLine, &state, &radio_support) == 0)
	{
		if (state != LINEEQUIPSTATE_FULL)
		{
			state = LINEEQUIPSTATE_FULL;
		}
		else
		{
			state = LINEEQUIPSTATE_MINIMUM;
		}
 
		lineSetEquipmentState(hLine, state);
	}
 
	CloseLine(hLine);
	ShutdownLineUtils();
 
	return 0;
}

Side note: LINEEQUIPSTATE_NOTXRX seemed to have no effect for me. My device turned the radio off on “MINIMUM” but refused the other option as unsupported.

As excellent and generally seamless as Visual Studio’s emulator was, it did not respond to lineSetEquipmentState at all. I guess since it’s not an actual device, maybe it doesn’t bother implementing the “equipment.”

Don’t call me pedantic!

A few weeks ago in a class, the professor mentioned that C does not support nested functions. He wrote an example on the board that he claimed would not compile.

A student quickly typed up the program on his laptop and said, “GCC compiled it just fine.” The professor replied, “Well, I’ve never heard of that. It must be a compiler feature unless they changed the standard.”

The student then said, “Well, I added -ansi and GCC still compiles it.” The professor caved in — “I guess they changed the standard recently.”

I was sure they most certainly didn’t. This incident bothered me since I knew nested functions couldn’t possibly be in C99. When I got home I reproduced the scenario, and sure enough, the student was right. GCC was compiling completely invalid syntax even with the “-ansi” setting. After digging through the documentation, I was able to find two things:

  • GCC has its own custom extensions to the C language, which includes nested functions.
  • This custom extension is enabled by default even if you choose a language specification where it does not exist.

As if that weren’t strange enough, GCC’s option to disable its custom additions appears to be called “-pedantic.” Uh, I don’t think it’s pedantic if I want the language to conform to the actual standard. As much as I like GCC and its custom extensions (many of which are pretty cool), they should be opt-in, not opt-out, in compliance modes.

I frequently see people say “Microsoft’s stupid compiler doesn’t conform to ANSI.” Well, after this, I’m not so convinced GCC is innocent either.

That said, GCC’s nested function feature and its implementation are both very cool. Taking a look at the disassembly, it does run-time code generation on the stack. Simple example:

Select All Code:
include <stdio.h>
 
int blah(int (*g)())
{
    g();
}
 
int main()
{
    int i = 0;
 
    int g()
    {
        i++;
    }
 
    g();
    blah(g);
 
    printf("%d\n", i);
}