Debugging the Impossible

A few days we released SourceMod 1.3 and suddenly got a few reports of crashing when clients disconnect. We couldn’t reproduce it, but a few users claimed they could. We had about ten minidumps to work with (they include a few KB of stack memory and that’s it).

All of the stack traces had a weird code address at the top and nothing else. Here’s two examples:

>	1673a14a()	

EAX = 0ED884B0 EBX = 00000000 ECX = 0EDAC948 EDX = 0EDA6A48 
ESI = 0DFFA95E EDI = 100F0101 EIP = 1673A14A ESP = 0012DA09 
EBP = 00000001 EFL = 00010282 
>	0e531992()	

EAX = 0ED884B0 EBX = 00000000 ECX = 0EDAC948 EDX = 0EDA6A4
ESI = 0DFFA95E EDI = 100F0039 EIP = 0E531992 ESP = 0012DA09
EBP = 00000001 EFL = 00010282 

These code addresses are weird because the debugger couldn’t map them to any loaded module. So they’re either dynamically generated/exploited, or garbage. What can we do with such little information? Surprisingly, a lot!

The first thing of interest was that ESP, the stack pointer, was not aligned correctly (it should be divisible by 4). This wasn’t the case in all minidumps, but it was a good hint, given that it was in the usual range for Windows main-thread stack addresses. The CPU was probably jumping to garbage memory, and decoded it to something that incremented ESP. So after stripping that extra theoretical increment off ESP, I could inspect its memory in Visual Studio:

ESP dump

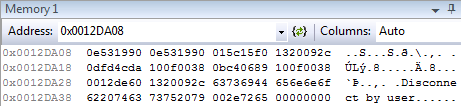
Whoa! A string on the stack suggests there was indeed something going on with client disconnects. Also, the value on the top of the stack – 0x0E531992 is very close to 0x0E531990. This was enough to form a wild guess: maybe the stack was misaligned, and the CPU picked the wrong return address to jump to. We can do better though.

The two most interesting binaries in the HL2 process are the engine and server. Let’s look at their address ranges in Visual Studio:

engine.dll   0BAF0000-0C10A000
server.dll   0DEB0000-0E3A4000

Two of the addresses close to the top of ESP fall into these ranges:
0x0012DA08 0e531990 0e531990 015c15f0 1320092c ..S...S.ð.\.,. .
0x0012DA18 0dfd4cda 100f0038 0bc40689 100f0038 ÚLý.8.....Ä.8...
0x0012DA28 0012de60 1320092c 63736944 656e6e6f `Þ..,. .Disconne
0x0012DA38 62207463 73752079 002e7265 00000000 ct by user......

Let’s take the outermost one first, since it may correspond to the stack frame that created that cool looking string. To go further, I like to use IDA – it’s a great disassembler and it has non-commercial and trial versions. With engine.dll loaded in IDA, all the addresses are wrong – luckily IDA can rebase the disassembly (Edit -> Segments -> Rebase Program):

Rebasing in IDA

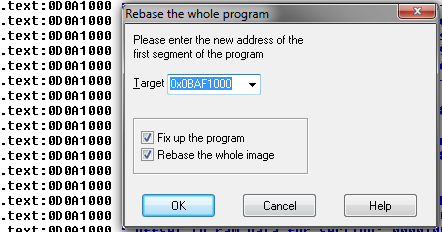
For some reason you have to add 0x1000 to get the right addresses – I don’t know why. Now I go to Jump -> Jump to Address, and type in 0bc40689, and find this:

.text:0BC40683    lea     edx, [edi-4]
.text:0BC40686    push    edx
.text:0BC40687    call    eax
.text:0BC40689    lea     ecx, [esp+8]

Well, that’s kind of troublesome. IDA can’t tell where an indirect call will go. So I scroll around the function and look for hints, and get lucky. This is right above:

.text:0BC405F9    push    0
.text:0BC405FB    push    offset aPlayer_disconn ; "player_disconnect"
.text:0BC40600    call    edx
.text:0BC40602    mov     esi, eax

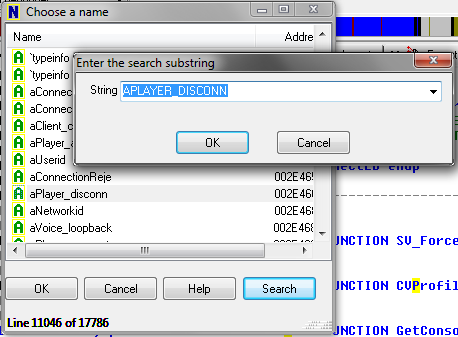
Again, this has something to do with player disconnects! Now I really want to know what function this is. Unfortunately Windows DLLS have symbols separated, but Linux binaries have them built-in. So I load the Linux version of the HL2 engine in IDA, and go to Jump -> Jump to Name, and type in aPlayer_disconn. By doing this I’m hoping the Linux binary has the same string, since IDA encodes string constants as unique names.

IDA name search

Here’s where IDA is extremely helpful – I click on aPlayer_disconn, and go to Jump -> Jump to cross reference:
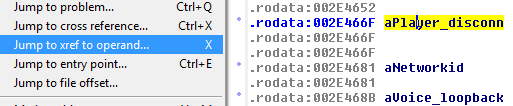
IDA xref menu

And now I get this:

IDA xref menu 2

So now our mystery call stack has CGameClient::Disconnect() in it. Progress! Now I want to know what that virtual call usually goes to. First I find the same call in the Linux binary. The Windows one had this:

.text:0BC4067D    mov     eax, [eax+0A8h]
.text:0BC40683    lea     edx, [edi-4]
.text:0BC40686    push    edx
.text:0BC40687    call    eax
.text:0BC40689    lea     ecx, [esp+8]
.text:0BC4068D    push    ecx             ; char
.text:0BC4068E    push    offset aS_12    ; "%s"
.text:0BC40693    push    edi             ; int
.text:0BC40694    call    sub_BBA2750

The Linux one is much harder to read because of GCC’s (asinine) PIC code, which IDA has trouble figuring out. But the basic pattern I’m trying to mentally match is:

  1. A virtual call that flows from a large virtual offset.
  2. The string “%s”.
  3. A non-virtual call.

In the Linux version, this looks really close:

.text:00102BE4    lea     edi, (aS_3+2 - 343D64h)[ebx]
.text:00102BEA    mov     edx, [eax]
.text:00102BEC    mov     [esp+43Ch+var_438], ebp
.text:00102BF0    mov     [esp], eax
.text:00102BF3    call    dword ptr [edx+0ACh]
.text:00102BF9    mov     esi, [esp+43Ch+var_428]
.text:00102BFD    mov     [esp+43Ch+var_438], edi
.text:00102C01    mov     [esp+43Ch+var_43C], ebp
.text:00102C04    mov     [esp+43Ch+var_434], esi
.text:00102C08    call    __ZN11CBaseClient10DisconnectEPKcz

Unfortunately IDA had trouble decoding the string reference – aS_3 points to “, %s” – but note it adds two bytes, making “%s”. Now I start a Linux server in GDB, and compute the address I want to break on. This is easy by taking the IDA difference and adding it to the function in the process:

(gdb) p _ZN11CGameClient10DisconnectEPKcz
$1 = {} 0xb75f4a70
(gdb) p/x 0x00102BF3 - 0x00102A70
$2 = 0x183
(gdb) p $1 + $2
$3 = ( *) 0xb75f4bf3
(gdb) b *0xb75f4bf3
Breakpoint 2 at 0xb75f4bf3

Now I add and kick a bot (bold red text is my input):

(gdb) c
Continuing.
sv_cheats 1
bot

Cannot verify load for invalid steam ID [A:1:0:1]
kickid 2
Breakpoint 2, 0xb75f4bf3 in CGameClient::Disconnect ()
from /home/builds/common/srcds/orangebox/bin/engine_i486.so
(gdb)

Yay, it hit! Now I step into the assembly to see where this goes:

(gdb) display/i $pc
2: x/i $pc 0xb75f6bf3 <_ZN11CGameClient10DisconnectEPKcz+387>: call DWORD PTR [edx+0xac]
(gdb) si
0xb75edf00 in CGameServer::RemoveClientFromGame ()
from /home/builds/common/srcds/orangebox/bin/engine_i486.so

Now back in IDA, I go to Jump -> Jump to function and search for RemoveClientFromGame. Of interest in this function is the following code:

.text:000F9F6A     mov     ecx, ds:(serverGameEnts_ptr - 343D64h)[ebx]
...
.text:000F9F81     call    dword ptr [ecx+10h]

Since we have the symbol info, here I don’t have to do extensive guess work – this is almost definitely an IServerGameEnts pointer, a singleton interface the engine uses to feed information back to the actual game. Here it’s calling the offset for IServerGameEnts::FreeContainingEntity. Could this be the other address we saw on the stack, 0DFD4CDA? It seems likely, given that there is one pushed value in between, and the disassembly has one push as well. Let’s compare the target functions in source and binary. From loading server.dll in IDA:

.text:0DFD4CD0    mov         eax,dword ptr [esp+4] 
.text:0DFD4CD4    push        eax  
.text:0DFD4CD5    call        sub_0DFFA920 
.text:0DFD4CDA    pop         ecx  
.text:0DFD4CDB    retn         4    

The same function from hl2sdk/game/server/gameinterface.cpp:

Select All Code:
void CServerGameEnts::FreeContainingEntity( edict_t *e )
{
        ::FreeContainingEntity(e);
}

These seem really similar. So it seems like we might be crashing in ::FreeContainingEntity(), at a point where the stack depth is around 4 values. But looking at this function, it’s not really clear what could be happening:

Select All Code:
void FreeContainingEntity( edict_t *ed )
{
...
        CBaseEntity *ent = GetContainingEntity( ed );
        if ( ent )
        {
                ed->SetEdict( NULL, false );
                CBaseEntity::PhysicsRemoveTouchedList( ent );
                CBaseEntity::PhysicsRemoveGroundList( ent );
                UTIL_RemoveImmediate( ent );
        }
...
}

In HL2 parlance, UTIL_RemoveImmediate() means “immediately destroy and deallocate this entity”. The point at which the stack depth becomes 4 is around this call – but not exactly. At this point I gave up for the night and asked the user if he had any more information. But from this, I had the following guesses:

  1. Call stack that looked something like:
    (?+0) server.dll!FreeContainingEntity()
    (?+1) server.dll!CServerGameEnts::FreeContainingEntity()
    (?+2) engine.dll!CGameServer::RemoveClientFromGame()
    (?+3) engine.dll!CGameClient::Disconnect()
    
  2. The CPU jumped to an invalid address somewhere.
  3. The invalid address may be from a return instruction and a misaligned stack.

Amazingly, he posted a working test case that involved adding and kicking a bot on a specific game. I tried this game, and managed to reproduce it! I narrowed the problem down to a minimal set of “extra junk running”, and from there SM developer Fyren noticed the problem pretty quickly.

SourceMod overwrites virtual table slots to “detour” function calls in between the engine and whatever game is running (in this case, Day of Defeat:Source). The slot number can differ between games, so it is specified in a configuration file. One of these configuration entries was missing, and SourceMod was accidentally overwriting the zeroth vtable entiry – the destructor! Now the sequence of events is clear:

  1. Engine tells the game that a client is disconnecting.
  2. Game destroys the client object.
  3. C++ calls the virtual destructor, but the vtable entry points to a SourceMod function.
  4. The Windows ABI uses a callee-pop convention on member functions. The virtual destructor should be popping no parameters, but the SourceMod function pops two, since the conventions don’t match.
  5. Once SourceMod’s replacement function returns, the CPU tries to load the return address, and gets garbage.

Phew.

Given that the patch that added this code baked for months, it’s amazing it slipped into a release. And for the record, it had two peer reviews. But there you have it. Sometimes it’s possible to draw blood from a minidump stone – but without a test case it’s unlikely we could have gotten this as quickly.

Login Changes for AlliedModders

SourceMod developer and occasional ITer Scott Ehlert (“DS”) has overhauled the way we do source code access at AlliedModders. If you have any kind of Mercurial, SVN, or CVS access with us, this pertains to you. If not, you probably want to save yourself the boredom and read something else.

Domain Names
All source code services are now on a separate server. You need to use hg.alliedmods.net, svn.alliedmods.net, cvs.alliedmods.net, etc. Using just alliedmods.net will not work.

Secure Accounts
If you used SSH access (“ssh://” or “svn+ssh://”) to access a repository, your account is no longer valid. Our new account system uses e-mail addresses for user names. We’ve made an easy website for converting your old account to an e-mail address based one:

https://www.alliedmods.net/internal/oldaccount

If you had source code access and you want to keep it, you MUST provide a PUBLIC key. You CANNOT push to source code repositories with a password anymore. Keys are required, and of course you should be careful to protect the private half of your key.

When accessing source code repositories, you need to use your full account name. For example, “[email protected]@hg.alliedmods.net”. If you have SSH access to our webserver, you can continue to use your old account name.

Repository URLs
For Mercurial users, you no longer have to type “//hg/” before every path. For example, “//hg/sourcemod-central” is now “/sourcemod-central“.

For Subversion (SVN) users, the same applies for “/svnroot“. If you had “/svnroot/users/dvander” it is now “/users/dvander“.

User Repositories
We now have a fairly easy way for developers to create their own Mercurial repositories without filing bugs and waiting. You can read more here:

http://wiki.alliedmods.net/Mercurial_User_Repositories

This replaces our old, vastly insecure Subversion management tool. We don’t really want to give out new Subversion repositories unless there are extenuating circumstances. If you would like changes to your SVN repo, or a migration to Mercurial, please just file a bug.

Credits
I think we’re in a much better position now to quickly give community developers the resources they need to do secure, versioned, shared development. There were quite a few trials and tribulations getting this thing working. DS worked on and off on this for a while, only taking a “break” to help out with the L4D2 porting effort. Hopefully it’ll all have been worth it – and a huge thanks to him regardless.

OS X and Windows Perspective, Updated

A year ago I started using OS X, and gave a bunch of thoughts on the experience. A year later, I’m using it exclusively. I’m sure you could pull up any number of UI mistakes in OS X – there are many. Perhaps I’ve adjusted or gotten used to them. When I need Windows, I usually fire up VMware and run XP.

A few days ago I installed Windows 7 on a spare computer. The experience was horrifying. It was like putting my head in a clamp that has complimentary electroshock therapy. What surprises me most is that I used to be a die-hard Windows fanboy. I’d have nasty arguments with mac users. I’d love touting MSDN and the WinAPI. I can’t even try to muster up this enthusiasm anymore. The Windows 7 (and Vista) UI drains my soul.

The Windows 7 installer kept freezing at two points in the process – before copying or disk formatting or anything! I waited about ten minutes before rebooting. Rinse, lather repeat. Finally someone told me I had to just wait it out, despite there being no I/O activity or visual feedback. Sure enough, after about 15-20 minutes of waiting it proceeded.

After starting up, the Aero UI was… ugly. Everything looked about a dozen pixels too thick. The glass effect looked like my UI had beer goggles, made worse by the way-too-bright default blue. So I turned border padding really low, turned off transparency, and made the border colors as solid as they could get.

Delays in responsiveness make the UI seem slow or broken, or like my computer isn’t fast enough. What baffles me is why Windows has arbitrary delays in the UI. Two examples.

The Start Menu has this right-hand pane that lists things like “Documents”, “Downloads”, “Computer”, etc. As you hover over these, a respective icon fades into view. But there’s a very noticeable delay… it feels around just under a full a second, until the fade-in begins. So your mouse can sit on the “Control Panel” text but still have the icon for “Run”.

Minimizing and maximizing windows also has noticeable delay. There’s some kind of animation, but it’s much slower than OS X. It’s distracting and slows down workflow. I went to “Advanced Performance Settings” which requires administrative access. I knew that changing the animations is a setting that reverts after reboot, but I gave it a shot. I unchecked the feature, clicked OK – and suddenly all my UI settings reverted. I was back to hideous blue, transparent Aero. Ugh. So I fixed my UI prefs again.

Next, I installed a secondary drive to copy old files. The drive showed up as “E:”, so I navigated to “E:\Users\dvander”. It asked for Administrative credentials. I typed in my password, and hit okay… but nothing happened. No response, but the drive started churning furiously. I tried again, but nothing happened. Now I was getting worried – I knew the drive had bad sectors. Was it finding more? Was it creating more? What was all this activity? Why couldn’t I access my folder?

I launched Explorer as an Administrator, but no luck. It still asked me for admin credentials, and still did nothing. I launched cmd.exe, and navigated to “C:\Users\dvander”. Surprise! I could read it fine from there. So what was going on with Explorer?

Then I noticed the path bar in Explorer was slowly filling up with green stuff. Was it Indexing? I Googled “disable indexing” and found this site. I still don’t understand the UI here. Try it out. There’s some sort of two-pane list of mutually exclusive terms, but a selection carries across both. You can select something and hit “Modify” but it seems like the “Modify” box has nothing to do with what you selected. I’m sure this is way more flexible than Apple’s Spotlight, if I could only understand it. It looks something like this (image from article):

I took a guess that “Users” was indexing everything in E:\Users, so I removed that and hit OK. Instantly, all that churning stopped, and Explorer brought up my folder!

Explorer was blocking the entire user interface on an automatic, massive, recursive indexing operation over all my files. The only feedback was an authentication dialog for something I had access to, that silently failed anyway.

With that solved, I started actually using things. The taskbar was too big, older Windows apps have icons that don’t scale properly. Hell, most actual Microsoft apps don’t. So I made it smaller, only to find that the circular “Start” button clips into the working area of a window. This did not happen on Vista. So I made the taskbar auto-hide (which still leaves a tiny sliver about 1-2 pixels thick).

Okay… I’ve been ranting a while now. Two more things. What’s with Windows 7 file dialogs?

When this thing pops up, the first thing I do is mouse wheel to get to the file I want. Oh, sorry, I meant I used to do that. In Windows 7, when this dialog appears, the mouse wheel does absolutely nothing. First you have to click inside the file list. Great, extra movement. This might even be a regression but I forget what XP did. Of all the Windows 7 idiosyncrasies, this one hits me the most frequently, and it’s really bothersome.

Finally, what’s with “Program Files (x86)” versus “Program Files”? As if spaces were bad enough in such an important path (thank God “Documents and Settings” is gone), now we have parenthesis? Why is there even a difference in the first place? It seems like some x64 stuff goes into the x86 folder, and vice versa, so what’s the point? Why isn’t this called “Programs”?

Phew. If only OS X could run Valve games.

Six Years Later, Steam is Still Annoying

It’s been a year or so since I fired up Steam to actually try and play a game. Given that I help maintain multiple mods for Valve games, that might seem surprising.

I love the concept of Steam, I’ve had it installed since the early betas, and I hated the days of scouring for files like “10161100.exe” to update Half-Life 1. But the actual software is so mind-bogglingly annoying. I cringe when I hear Steam fanboys tout it as the shining jewel in content distribution.

To demonstrate, I recently got a desktop and decided to try playing a game I paid for on Steam. I downloaded Steam, installed it, and instantly got bombarded with stuff like this:

Steam Notifications

These three things would slide down, then three more would pop up. Rinse and repeat every few seconds. Really annoying. I have Steam Friends completely pref’d off on my laptop, but I guess Steam doesn’t sync account settings across computers. I’d rather not disable Steam Friends completely, but of the three options to disable notifications, none seem related to the ones up above. So I pref’d Friends off. The little messages kept coming though, until the whole list of notifications was exhausted.

Later I came back and tried to install a game. It said “Your Steam ticket has expired” and asked for my password. I typed it in, and nothing happened. The dialog disappeared but the game wasn’t downloading. I double-clicked the game to try again. It asked for my password again, but no-go.

I tried this a few more times, then restarted Steam. When it started back up, all of the icons were missing:

Steam - No Icons

Okay, that’s weird. I double-clicked the game again, and I still got the expired ticket dialog box. I typed in my password again, but this time selected “Remember my password”. The game didn’t start installing, but the icons appeared.

I tried installing again, and now I got a new dialog box: “The Steam servers are currently too busy to handle your request.” Huh? The next try got me back to the password entry dialog box because my “Steam ticket” had expired again.

I searched Google and found a Steam forum thread describing my problem. Another thread linked from comment #11 said to try deleting “ClientRegistry.blob”, and if that doesn’t work, reinstall Steam.

So I exited Steam, deleted “C:\Program Files (x86)\Steam\ClientRegistry.blob”, and restarted. When I tried installing the game, I actually got a progress bar. By the time it had finished downloading I’d moved on to other things, but at least next time I’m in the mood to play a game on Steam, I know to delete random internal files.

This product… needs polishing.

64-bit TraceMonkey!

As of an hour ago, Mozilla’s JavaScript engine now has 64-bit JIT support turned on by default in the TraceMonkey tree only. We currently don’t ship a 64-bit browser, but we will eventually, and this is an important step in making sure we’re staying optimized on all major platforms.

If you are bleeding-edge and build your own 64-bit Firefox, you can now easily try out the JIT and report any problems.

A nice discovery was that the 64-bit engine as a whole outperforms 32-bit builds. SunSpider ran about 20% faster, comparing both 32-bit and 64-bit builds with and without the JIT.

For more information see this newsgroup post on
mozilla.dev.tech.js-engine

Trace Compilation and Recursion, Part 1

TraceMonkey does really well at lots of benchmarks. Specifically, it does well at benchmarks that it can trace compile. If for some reason a loop contains a code path that cannot be traced, that path will never run inside the JIT – instead it stays in the interpreter, which is much slower.

There isn’t much left that we can’t trace, but when that happens, it lights up benchmarks in bad ways. One of the areas we don’t trace at all is recursion.

Recursion isn’t too common on the web but it’s still a big hole in our functionality, so I worked on it quite a bit this summer. Unfortunately it’s non-trivial, and still hasn’t landed, but I’d like to talk about what I do have working.

Quick Introduction

TraceMonkey uses trace trees. If some repetitive code is run, like a loop, a trace recorder kicks in. This records the behavior of the code for one iteration. If any behavior could diverge at runtime – such as an if branch – it becomes a “guard”, and we only record the observed path.

We assemble these observations into statically-typed, native CPU code. If a guard is triggered while running this new, faster code, it means the behavior has changed. We start recording a new path, and attach it to the point of divergence. Thus the code is literally a tree of traces.

Recursion is a Loop, Sort Of

Recursion is a loop, so we’d like to compile as such, using the behavior we observe at runtime. Let’s look at a simple recursive function and identify where it loops.

Select All Code:
function factorial(n) {
  if (n == 0)
    return 1;
  return n * factorial(n - 1);
}

What happens when you call factorial(10)? It starts off in the interpreter here:

Select All Code:
  if (n == 0)

n isn’t 0, so the indented path gets skipped.

Select All Code:
  return n * factorial(n - 1);

First n - 1 evaluates to 9. Then factorial() is called again, and we’re back at:

Select All Code:
  if (n == 0)

Bam. We’ve hit the same point, and thus identified a repeating pattern. To make sure it’s hot, the tracer recorder waits for one more iteration. Then it kicks in and starts recording the behavior it sees. Is (n == 0)? No, n is 8, so the tracer records:

Select All Code:
1: guard n != 0

Next, the trace compiler sees the n - 1 and function call and records those.

Select All Code:
2: subtract(n, 0x1)
3: add stack space (frame) for factorial call
4: n = result of instruction #2

Next the trace recorder sees if n == 0, which is where it started recording. It adds a “jump to the beginning” instruction and compiles the trace to native code. Visually it looks something like this:

Down recursion

But wait! That’s only “half” of the function. Specifically, it’s the down-recursive half, which dives deeper and deeper. What happens when we run this? The code will build a bunch of stack frames that look like this:

frame # variables
9 n = 0
8 n = 1
7 n = 2
6 n = 3
5 n = 4
4 n = 5
3 n = 6
2 n = 7
1 n = 8

When n == 0, the guard fails. This is really nasty. It turns out the JIT and interpreter have completely different ways of representing stack frames, and when transferring control the frames must be converted from one to the other. Locally, this process is really expensive. As you can imagine it is disastrous for deeply recursive functions. The only way to fully mitigate this is to make sure we spend more time in the JIT. Ideally, we never want to reconstruct any frames.

Upwards Recursion

But back to what happens. n == 0, the guard has triggered, and we’re back in the interpreter. The recorder only wants to observe hot code, so it doesn’t record the path from the guard yet. Now we see this get executed:

Select All Code:
  if (n == 0)
    return 1;

Remember, we’re at frame #9 from the diagram above. The “return” instruction pops us to frame #8, and now we’re at:

Select All Code:
  return n * (result of factorial(n - 1));

This returns 1 * 1 to the calling function, and now we’re at:

Select All Code:
  return n * (result of factorial(n - 1));

We’re back at the same place! That’s a loop. This time 2 * 1 is multiplied to return 2. The trace recorder kicks in and starts recording from frame #6, but hits a snag: it sees a return, but hasn’t recorded a matching function call for this trace. This is where things get weird. How can it observe a return if it doesn’t know anything about frame #5?

It can’t. That’s sad, but we really want to solve this. If the JIT can unwind its own recursive frames, we won’t hit that expensive synthesizing path. The trick is to infer some uniquely identifying information about frame 5: its variable’s types and program counter. We guard on that identity. If that guard fails at runtime, we know that it is illegal to keep popping frames.

The resulting trace looks like this:

Upwards recursion

Linking the Two Halves

Hopefully, the down-recursive side will be run again. When the n == 0 guard hits, it will be “hot”, and the recorder starts up. This time it notices the “return”, looks at the above frame, and recognizes that recursion is unwinding. It links the two traces together like so:

Recursion, linked together

Beautiful! Except for…

Next Time

There are still problems with this approach. The major one is that by the time the up-recursive frame is built, all of the frames exist on the interpreter – not the JIT. When control transfers from the interpreter to the JIT, only one frame is converted because the process is very expensive.

That means the first up-recursive guard will hit, since there are no more JIT frames. We’ll do the expensive reconstruction process on the same frame, transfer it back to the interpreter, then re-enter the interpreter. This will happen for each frame until the recursion is unwound, all to execute a few multiplies!

That’s REALLY bad. To make things worse, this whole process will happen at least twice. The first time is to unwind the initial down recursion. The next time is because the n == 0 guard fails, and all the frames are popped off the JIT and transferred to the interpreter again. Everything only runs smoothly on the third invocation of the recursion function.

Next time I’ll discuss approaches to solving that situation.

Graduate School Lost

About six months ago I applied to $UNIVERSITY to enroll in its Computer Science PhD program. I had just crammed a four year undergraduate degree into six years, as my father jokes.

Whether or not to accept admission was a deeply divisive decision for me. I got a lot of opinions from family and peers. I went searching online for advice articles. It was a lot to digest and I ended up accepting the offer in March. The internal struggle didn’t go away, but the voices around me did. In July I paid my first rent check, still uneasy.

Come August, there was a defining day – no, moment – when I realized I did not want to go to graduate school. It was so blinding that I had to get out immediately. The intensity of the feeling subsided the next day (and I cannot “reproduce” it now), but it didn’t matter. I had seen the path I truly wanted to take.

I’m omitting my reasons since I don’t want to unduly influence anyone else approaching any level of education. I’ve done this too much in the past – it’s not my place. Everyone must follow their own path, and only by stewing over the decision alone for five months was I able to get closure.

To the people who gave me the (much needed) confidence and support in getting into school, and who I subsequently inconvenienced, I am deeply appreciative. I’m truly sorry it didn’t work out.

But now that is all behind me, and as of September 1st, I look forward to doing fo’ realz what I love doing.

Very shortly: a much less emo article on tracing recursion.

Computer Go, Part 3

As my senior project in college, I worked on algorithms for Computer Go. A few weeks ago I talked about the UCT algorithm, the most popular algorithm as of late. UCT plays random games to explore the value of potential game tree paths. It converges to a reasonable answer much faster than normal Monte-Carlo searches.

My project ended up being about experimenting with playout policies. A playout policy is just a fancy way of saying, “How do you play a random game?”

If you play ten random games from a single position, you probably won’t get a very accurate average score. If you play 10,000 you still might not get an accurate score! This inaccuracy means that even though UCT is a good algorithm, it will take longer (since you need more random games) to converge to an acceptable answer. Garbage in, garbage out.

One of the current Computer Go champions, MoGo, was also one of the first to use UCT. Their paper improved random playouts by introducing “local shape features.” (Gelly et al). It looks for “interesting shapes” on the board, and leans towards playing those instead.

What’s an interesting shape? Take this position with black to move:

Ignoring the rest of the board, the position marked a is pretty much the only move for black. It is a strong move that effectively captures territory, attacks the white stone, and deprives it of a liberty. Position b is also potentially interesting for similar reasons.

This kind of knowledge is really vague though. How can you make a quick test about whether something is interesting? MoGo decided to use hand-crafted information about 3×3 shapes. It takes every legal position on the board, and looks at the 8 stones around it. These form a pattern, and can be looked up in a pattern database. To see how this works, let’s take the two a and b positions from earlier, as if we were about to play at the center of a 3×3 area:

These are both patterns for the very favorable hane shape. Patterns are pretty flexible. You can introduce wildcards at intersections (which MoGo does). You can assign weights for a probability distribution. You can use neural networks to train them.

Patterns are also pretty fast as long as you stay under a 3×3 grid. Since the center is always empty, there are only eight stones to check. Of these eight, each intersection has four possibilities: Black, White, Empty, or Edge (edge of the board). That’s 4^8, or 2^{16} possibilities. That means you can encode a pattern with just a 16-bit integer, and you can use that as an index into a 65,536-length array.

As an added bonus, patterns have identical symmetries. If you mirror or rotate a pattern, it is the same. If you flip the colors, you can also flip the score – meaning that you only need to store scores for one color. Combined with the fact that most patterns are not legal, there are under 2,000 unique 3×3 patterns. In fact, the two patterns above are identical.

There are also patterns which are bad, and should probably be discouraged during normal play. For example, this pattern is the empty triangle, and you never want to play it:

Why are patterns useful, despite being local and having no knowledge about the board? They serve as an effective, quick local evaluation that is ideal for generating random games. A purely random game will have many bad moves. Pattern knowledge helps add some potentially good moves into the mix. MoGo claims to have gotten huge gains from their pattern knowledge.

For my project, I was tasked with trying out a few neural-network training algorithms for 3×3 patterns. The goal was to spit out a pattern database and compare the performance against other computer programs. I did all my work off an open-source project called libEGO.

Now, I love open source. I don’t love libEGO. It’s a messy project. The code is near-unreadable, there are almost no useful comments, the whitespacing is peculiar at best, bad at worst, and the formatting is atrocious. But it was small and had high coverage density, which made it ideal for experimentation.

I used a softmax function for choosing the next random move based on a pattern database. Every legal position on the board got a score of e^p, where p is the value of the pattern at that position. The denominator of the probability is the sum of those scores for the entire board. The numerator is the score of a specific location on the board.

I tried a bunch of reinforcement learning functions from a recently published paper. Testing was a pain. Levente was kind enough to lend me access to a 100-node grid. I easily ate up every node for days on end. I hacked up Python scripts to battle-royale dozens of configurations against each other and spit out statistics. It was fun to see the results and analyze the games, but a single mistake could throw out a ton of time, since I’d have to recycle all the tests.

And I did make mistakes. With only 5-6 weeks of actual working time available, I had a few setbacks and I had to rush near the end. I didn’t end up with great results. On the other hand, I learned a lot, and I got to talk with one of the masters in the field every day. So in the end I really enjoyed the project, despite not being very good at AI.

I’m still fascinated by Go, and now UCT. I wrote some other UCT programs in between school ending and returning to Mozilla. One for Shogi, and one for m,n,k games (such as Connect 4 and Tic-Tac-Toe). The Shogi one didn’t do too well – I didn’t have enough domain knowledge to write a good evaluation function, and thus playouts were really slow. Connect 4 fared better, though my implementation would lose to perfect play. Tic-Tac-Toe played perfectly. twisty did an implementation as well and I believe managed to get perfect play on Connect 4.

Alas, I’m not sure if I’ll spend more time on it yet. My real calling is elsewhere.

Quick String Interning Benchmark

While working on a project, I was wondering how to most efficiently implement string internalization. String “interning” is when two strings that compare true always have the same reference. This is quite nice as you can test if two strings are equal by just comparing their pointers.

It seems everyone uses hash tables for this, and indeed when I asked someone with more VM experience, he suggested using hash tables as well. I was still curious though, especially since SourceMod has a fancy-pants compressed “double-array” trie implementation. We knew that insertion time was poor, but I secretly hoped that this cost would be amortized over the much faster retrieval case.

I took a dump of ~5MB of plugin text from the forums and extracted all syntactically valid identifier tokens (including ones found in comments and strings). In total I had 553,640 strings, of which 19,852 were unique. This seems pretty reasonable as people tend to use similar names for identifiers. I set up four benchmarks:

  • std::map<std::string, int> — Typical STL container (red-black tree I think)
  • SourceMod::KTrie<int> — SourceMod’s Trie container
  • SourceHook::THash<const char*, int> – SourceHook’s “TinyHash,” chained hash table
  • SourceHook::THash<std::string, int> – Same, with more allocation involved

As a note, “TinyHash” is one of the first ADTs I tried to write, and it shows. Its stock find() function iterates over the whole table, instead of computing a hash, which is really slow. I filed a bug on this and hacked up my local copy to benchmark.

Each test gets run twice. The first “batch” run goes over all identifiers and inserts them if they are not already in the container. The second “retrieval” run does the same thing, except now there will be no string insertions since the table is populated.

Here’s the results, in milliseconds. I used the Intel C++ Compiler, version 10, on my Macbook Pro (2.4GHz Core 2 Duo, 4GB RAM).

Whoa! Everyone was right. Well, I knew that insertion on our Trie was pants, but I was surprised to see that the cost was in no way amortized. In fact, it wasn’t even faster on retrieval! Why? I don’t know (yet), but if I had a guess, it’s because our Trie has to peek at memory a lot. David Gregg explained to me that the advantage of tries is sorting. He also theorized it might be faster on long strings, which is in line with my original benchmarks ages ago, where I used very long randomized strings. (Tries are also good for compression.)

Well, I has sad. Looks like we’ll be ditching KTrie for a chained hash table. At least for string interning. Someone is welcome to request a hash table ADT for SourceMod scripting as well.

I also benchmarked non-PGO ICC and non-PGO g++-4.2 if you would like to see other compilers.

Note 1: Go article returns next week.
Note 2: Firefox 3.5 comes out tomorrow (June 30th!)

Computer Go, Part 2

Last week I gave an introduction to Computer Go, and left off mentioning that the current hot topic is Monte-Carlo methods. These methods use repeated random gameplay to sample a position’s value.

How do programs use random gameplay to reach a good conclusion? While you can sample specific positions, you only have finite time. How do you balance simulating one interesting position over another?

A few years ago a breakthrough algorithm was published, called UCT (Upper Confidence Bounds applied to Trees). The algorithm attempts to minimize the amount of sampling needed to converge to an acceptable solution. It does this by treating each step in the game as a multi-armed bandit problem.

Bandit Problem

A bandit is a slot machine. Say you have a slot machine with some probability of giving you a reward. Let’s treat this reward as a random variable X. You don’t know the true value of X, but by playing the slot machine repeatedly, you can observe an empirical reward, which is just an average (\mu).

Now consider having k slot machines, each expressed as a random variable X_1 \ldots X_k. Once again, you don’t know the true value of any X_i. How can you choose the right slot machine such that you minimize your losses? That is, you want to minimize the loss you incur from not always playing the most optimal machine.

Well, if you knew the true values of each machine, you could just play on the one with the greatest reward! Unfortunately you don’t know the true values, so instead you conduct trials on each machine, giving you averages \mu_i. You can then use this information to play on the observed best machine, but that might not end up being the most optimal strategy. You really need to balance exploration (discovering
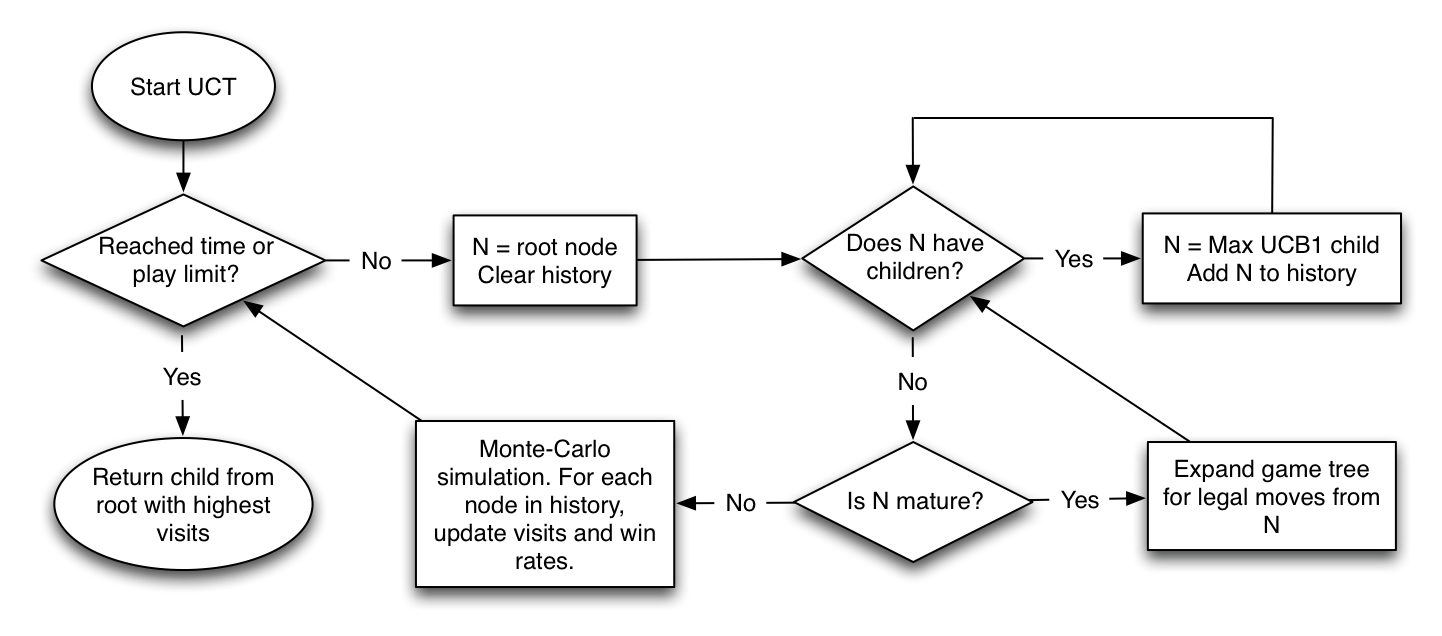
 \mu_i) with exploitation (taking advantage of the best \mu_i).

A paper on this problem published an algorithm called UCB1, or Upper Confidence Bounds, which attempts to minimize regret in such multi-armed bandit problems. It computes an upper confidence index for each machine, and the optimal strategy is to pick the machine with the highest such index. For more information, see the paper.

UCT

Levente Kocsis and Csaba Szepesvarí’s breakthrough idea was to treat the “exploration versus exploitation” dilemma as a multi-armed bandit problem. In this case, “exploration” is experimenting with different game positions, and “exploitation” is performing Monte-Carlo simulations on a given position to approximate its \mu_i. UCT forms a game tree of these positions. Each node in the UCT tree stores \mu_i and a “visit” counter. The confidence index for each node is computed as:

\mu_i + \sqrt{\frac{2\ln(parent.visits)}{child.visits}}

Each run of the algorithm traverses down the tree until it finds a suitable node on which to run a Monte-Carlo simulation. Once a node has received enough simulations, it becomes “mature,” and UCT will start exploring deeper through that position. Once enough overall simulations have been performed, any number of methods can be used to pick the best action from the top of the UCT tree.

How this all worked confused me greatly at first, so I made what is hopefully an easy flow-chart diagram. In my implementations, UCT starts with an empty tree (save for the initial moves the player can make).

UCT Algorithm

UCT converges to an acceptable solution very quickly, can be easily modified to run in parallel, and can be easily interrupted. It has seen massive success; all competitive Go programs now use it in some form.

Levente’s paper: click here

Next week: Monte-Carlo simulations and my project.