Two weeks ago, a bunch of Mozillans went on a whirlwind tour of Indonesia, visiting Firefox 4 release parties around the country. We had a great time, and I found the trip really enlightening. Luke Wagner and Christian Legnitto handled the first four days of the trip, and then Dave Mandelin, Josh Aas and I did the rest.
Dave and I started off in San Francisco, making a 22-hour journey to Jakarta, with a stop in Taipei. We brought along extra suitcases full of Mozilla swag to give away: by my count about eight-hundred billion elastic headbands. It must have looked like a ton of cocaine when we put our luggage through the X-ray machine at customs. The security guards opened the suitcases up and looked perplexed, but let us go after I donned a headband for demonstration.
After immigration we met community members Viking Karwur (@vikingkarwur), Yofie Setiawan (@yofiesetiawan), and Arry T, the owner of a local private school. Arry took us to a restaurant where you order by walking around rows and rows of open coolers, filled with random frozen fish, live crabs, mussels, et cetera. We paced around with an empty cooler and grabbed what seemed like one of everything. (Mr. Burns: “I’ll just have a glass of milk… from THAT cow.”) Lo and behold about thirty minutes later it all arrived at our table fully cooked, and tasted great.

The next day we got up early and flew to Surabaya with Yofie (he was excited, it was his first time flying). The Surabaya venue took place in a shopping mall, with maybe 100-200 people showing up. There was a talk about web design (spoken entirely in Indonesian, but the slides were in good English), another from Yofie about, I think, Mozilla Indonesia, and then Dave, Josh, and I each presented a little bit about Firefox 4, concluding with JSNES and Flight of the Navigator demos. Then there was a kind of ribbon-cutting ceremony which involved a giant mound of rice. Each of us had to take a spoonful off the top without dropping it, which was surprisingly tricky.
What really surprised me was how much everyone liked Firefox – it has a huge market share in Indonesia, something like 77% – and how people were really excited that we came to visit. I think we spent a full thirty minutes posing for photographs at each event. As a C++ developer you don’t get treated like a rockstar too often, so that was pretty awesome (albeit exhausting). Afterward we got some local food, but I was so tired I don’t remember what it was.

The next day we drove three hours to Malang, which was actually a good chance to get a look at the country. The venue was at the polytechnic university, where we were treated to a plaque and boxes of local snacks. The students there had great questions. Recurring ones were: why does Firefox use so much memory? (we’re working on it), and when will it get a Blackberry port? (likely, never, but it’s a popular phone there). After Q&A we each talked a bit about why we like working for Mozilla, and Dave cut a ribbon which released a big balloon. A few students were interested in how to start a career at Mozilla, I wasn’t quite sure what to say but the internship program and just community involvement seem like great vectors. Unfortunately, Dave got pretty sick on the ride back to the hotel, so he was down for the next day.
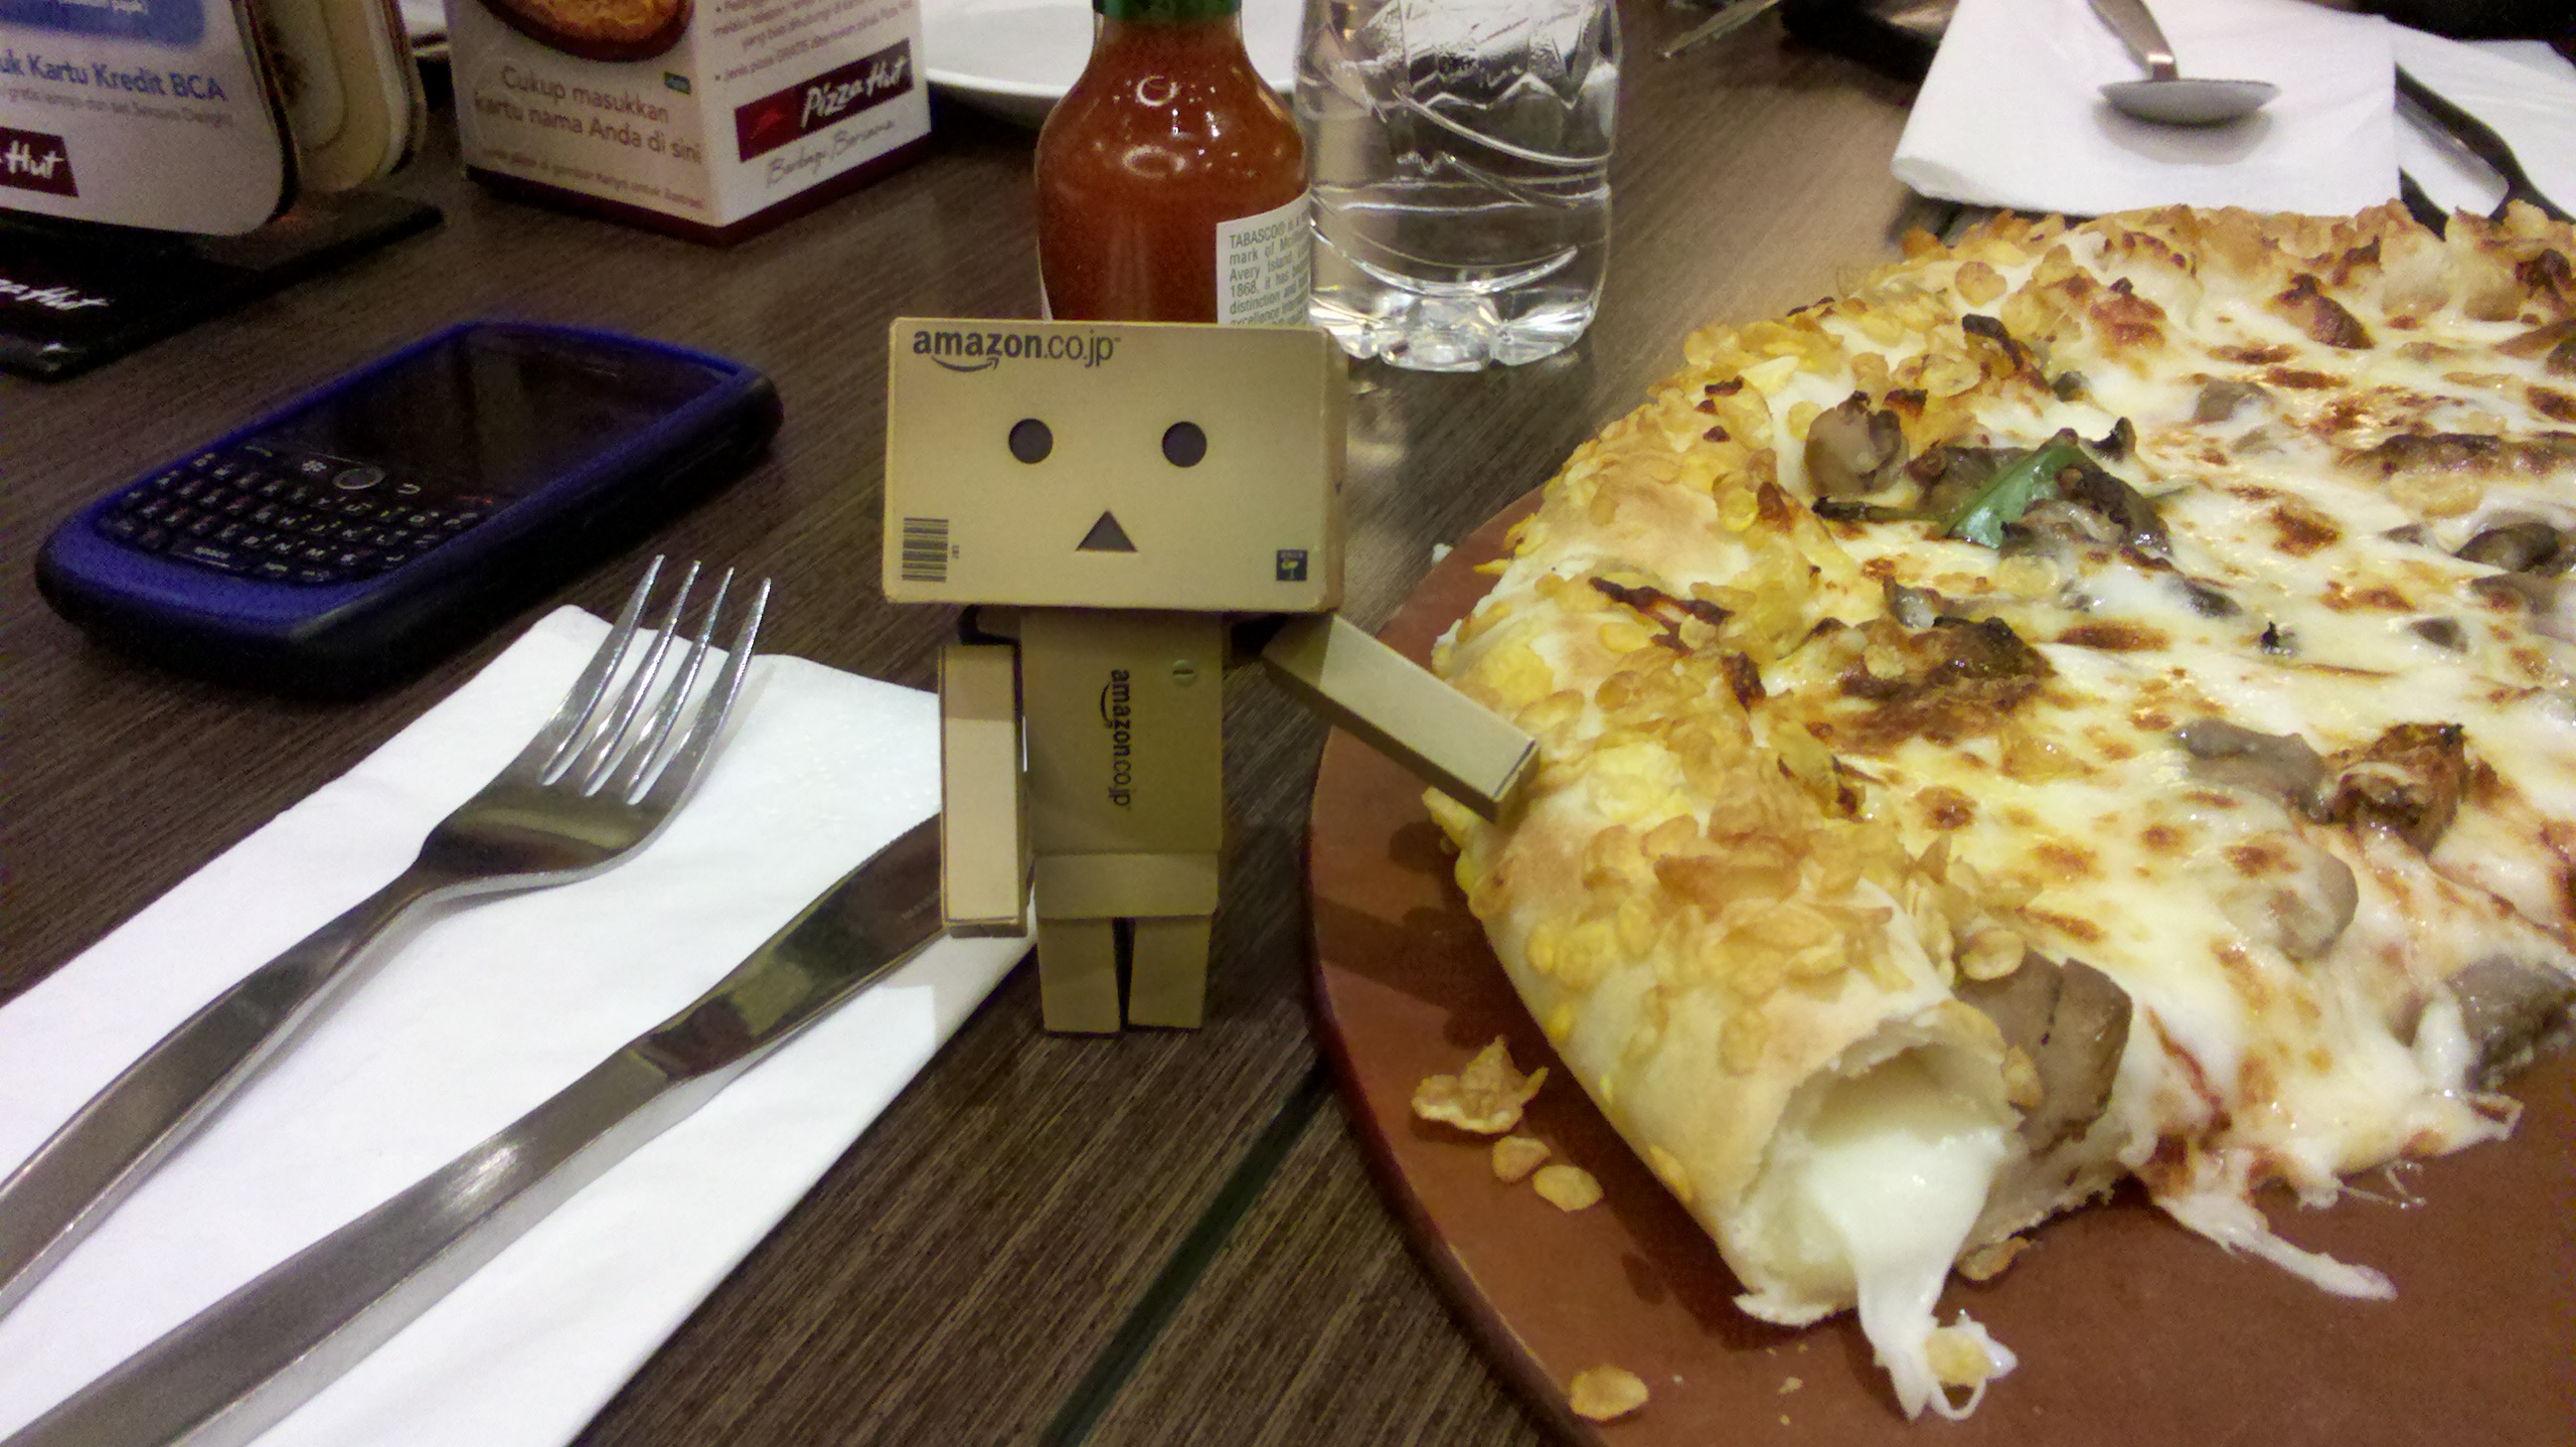
At the Makassar event we temporarily lost Yofie as our babysitter, instead being placed in the capable hands of Rara (@rara79) and Mamie (@alwaysmamie). The event was in a café, and a structured a little more rigorously than the others – most questions were in Indonesian and translated by the MC. The audience seemed to be lots of bloggers and web developers in the community. Questions seemed to fall into four main categories: Memory use, support for Java phones, UI changes and support issues, and wondering where the money comes from. All good questions! Afterward, we went to Pizza Hut (of all places – it was actually pretty fancy), and got cheese-stuffed crust with cornflakes.

Finally, on the last day, we flew to Bali and met up with Viking and Yofie again. Josh and I relaxed at the resort pool which was occupied mostly by Australians. In the evening we went to a local café for a smaller venue, maybe a dozen people, with a local radio host as MC. At our table sat an American expatriate, Ken McClellan, CTO of Mitrais who talked about what it’s like living and running a company in Indonesia.
Indonesia is very clearly a developing country. Foreigners are advised not to drink the tap water, and to be careful about uncooked food, as they won’t have the same resistances as locals. In cities you can see a striking mix of poorer and middle-class areas, and the pollution near congested roads can be very noticeable, at least if you’re asthmatic like me. Traffic is amusingly chaotic – turn signals, stop lights (there are very few), and speed limits are all optional. When you’re in a car, honking is nearly constant as an advisory measure, since there are no clearly defined lanes, and the majority of vehicles on the road are motor scooters. Jakarta even had motorized rickshaws, most were very old, adding to the anachronistic mix of old and new technology. It seems like despite this, traffic was actually pretty reasonable, though as a Californian used to big open roads with camera-enforced stop lights every ten feet, I’d be too nervous to try driving.
The national airline, Garuda, was much higher quality than any domestic airline in the States. It kind of reminded me of what flying was like before 9/11, or when American airlines weren’t terrible. I guess what sums this paragraph up is that the flight seat pockets had pamphlets advertising “Investing in Indonesia.” I’m really curious as to what the country will look like in 20-30 years, because it seems like it’s growing rapidly.
All in all, it was a great trip, and I’d definitely go back. It helped having a local guide; Yofie, Viking, and others’ help was really appreciated. The food was great (Nasi Goreng anything, Oxtail Soup were my favorites), and cheap (coming from USD), and everyone we met was friendly – even complete strangers walking around. It was awesome seeing everyone so excited about Firefox, and whatever we’re doing that makes Firefox so popular in Indonesia, we should figure it out and do it more!

I am not Justin Bieber.
I would be remiss if I didn’t conclude by mentioning how people thought I was Justin Bieber. It was so persistent that Josh started calling me Justin. Near the end of the trip, swimming in Bali, he said that when my hair was slicked back it was “way more manly,” so I tried that for a day, but decided I couldn’t afford the daily metric ton of hairgel. Incidents of mistaken Bieber identity:
- A few times in person at each event, including this tweet.
- People were whispering it at the airport in Makassar.
- Walking around Makassar, people rolled down the windows of their cars and called out at me and Josh.
- Running into a group of loitering teens, they asked “who I was” and burst out giggling when I shrugged.
- An airport employee in Makassar waved to me from behind a booth and yelled “Justin Bieber”! – I had to wave back.
Well, now that my pop star career is over, I’ve decided to go into dynamic language optimization.


